Your Org Isn't a Tree. It's a Graph.
Understanding how work actually flows across teams, roles, and tools through Organizational Network Analysis (ONA) — and why it matters for building better companies.


Every company runs on collaboration. But if you ask most execs how work actually gets done, you’ll get a story based on org charts and job titles — not how things actually move forward.
At Windmill, we’re building the operating system for modern organizations. To do that, we have to understand how work actually flows — across teams, roles, and tools. Who’s working with whom, on what, and through which channels? That’s the real organizational map. And it’s almost never the one on paper.
Org Charts Are a Starting Point — Not the Truth
Org charts show formal structure, not functional reality. They tell you who reports to whom, but not who actually solves problems together.
Sometimes, cross-functional groups are created on purpose. More often, they just emerge — a designer jumps in to help an engineer, or a sales rep partners up with a marketer on a customer story. Sometimes that’s healthy. Other times, it leads to misalignment or duplicated work.
To improve how your organization operates, you need to understand collaboration as it actually happens.
That’s where Organizational Network Analysis (ONA) comes in.
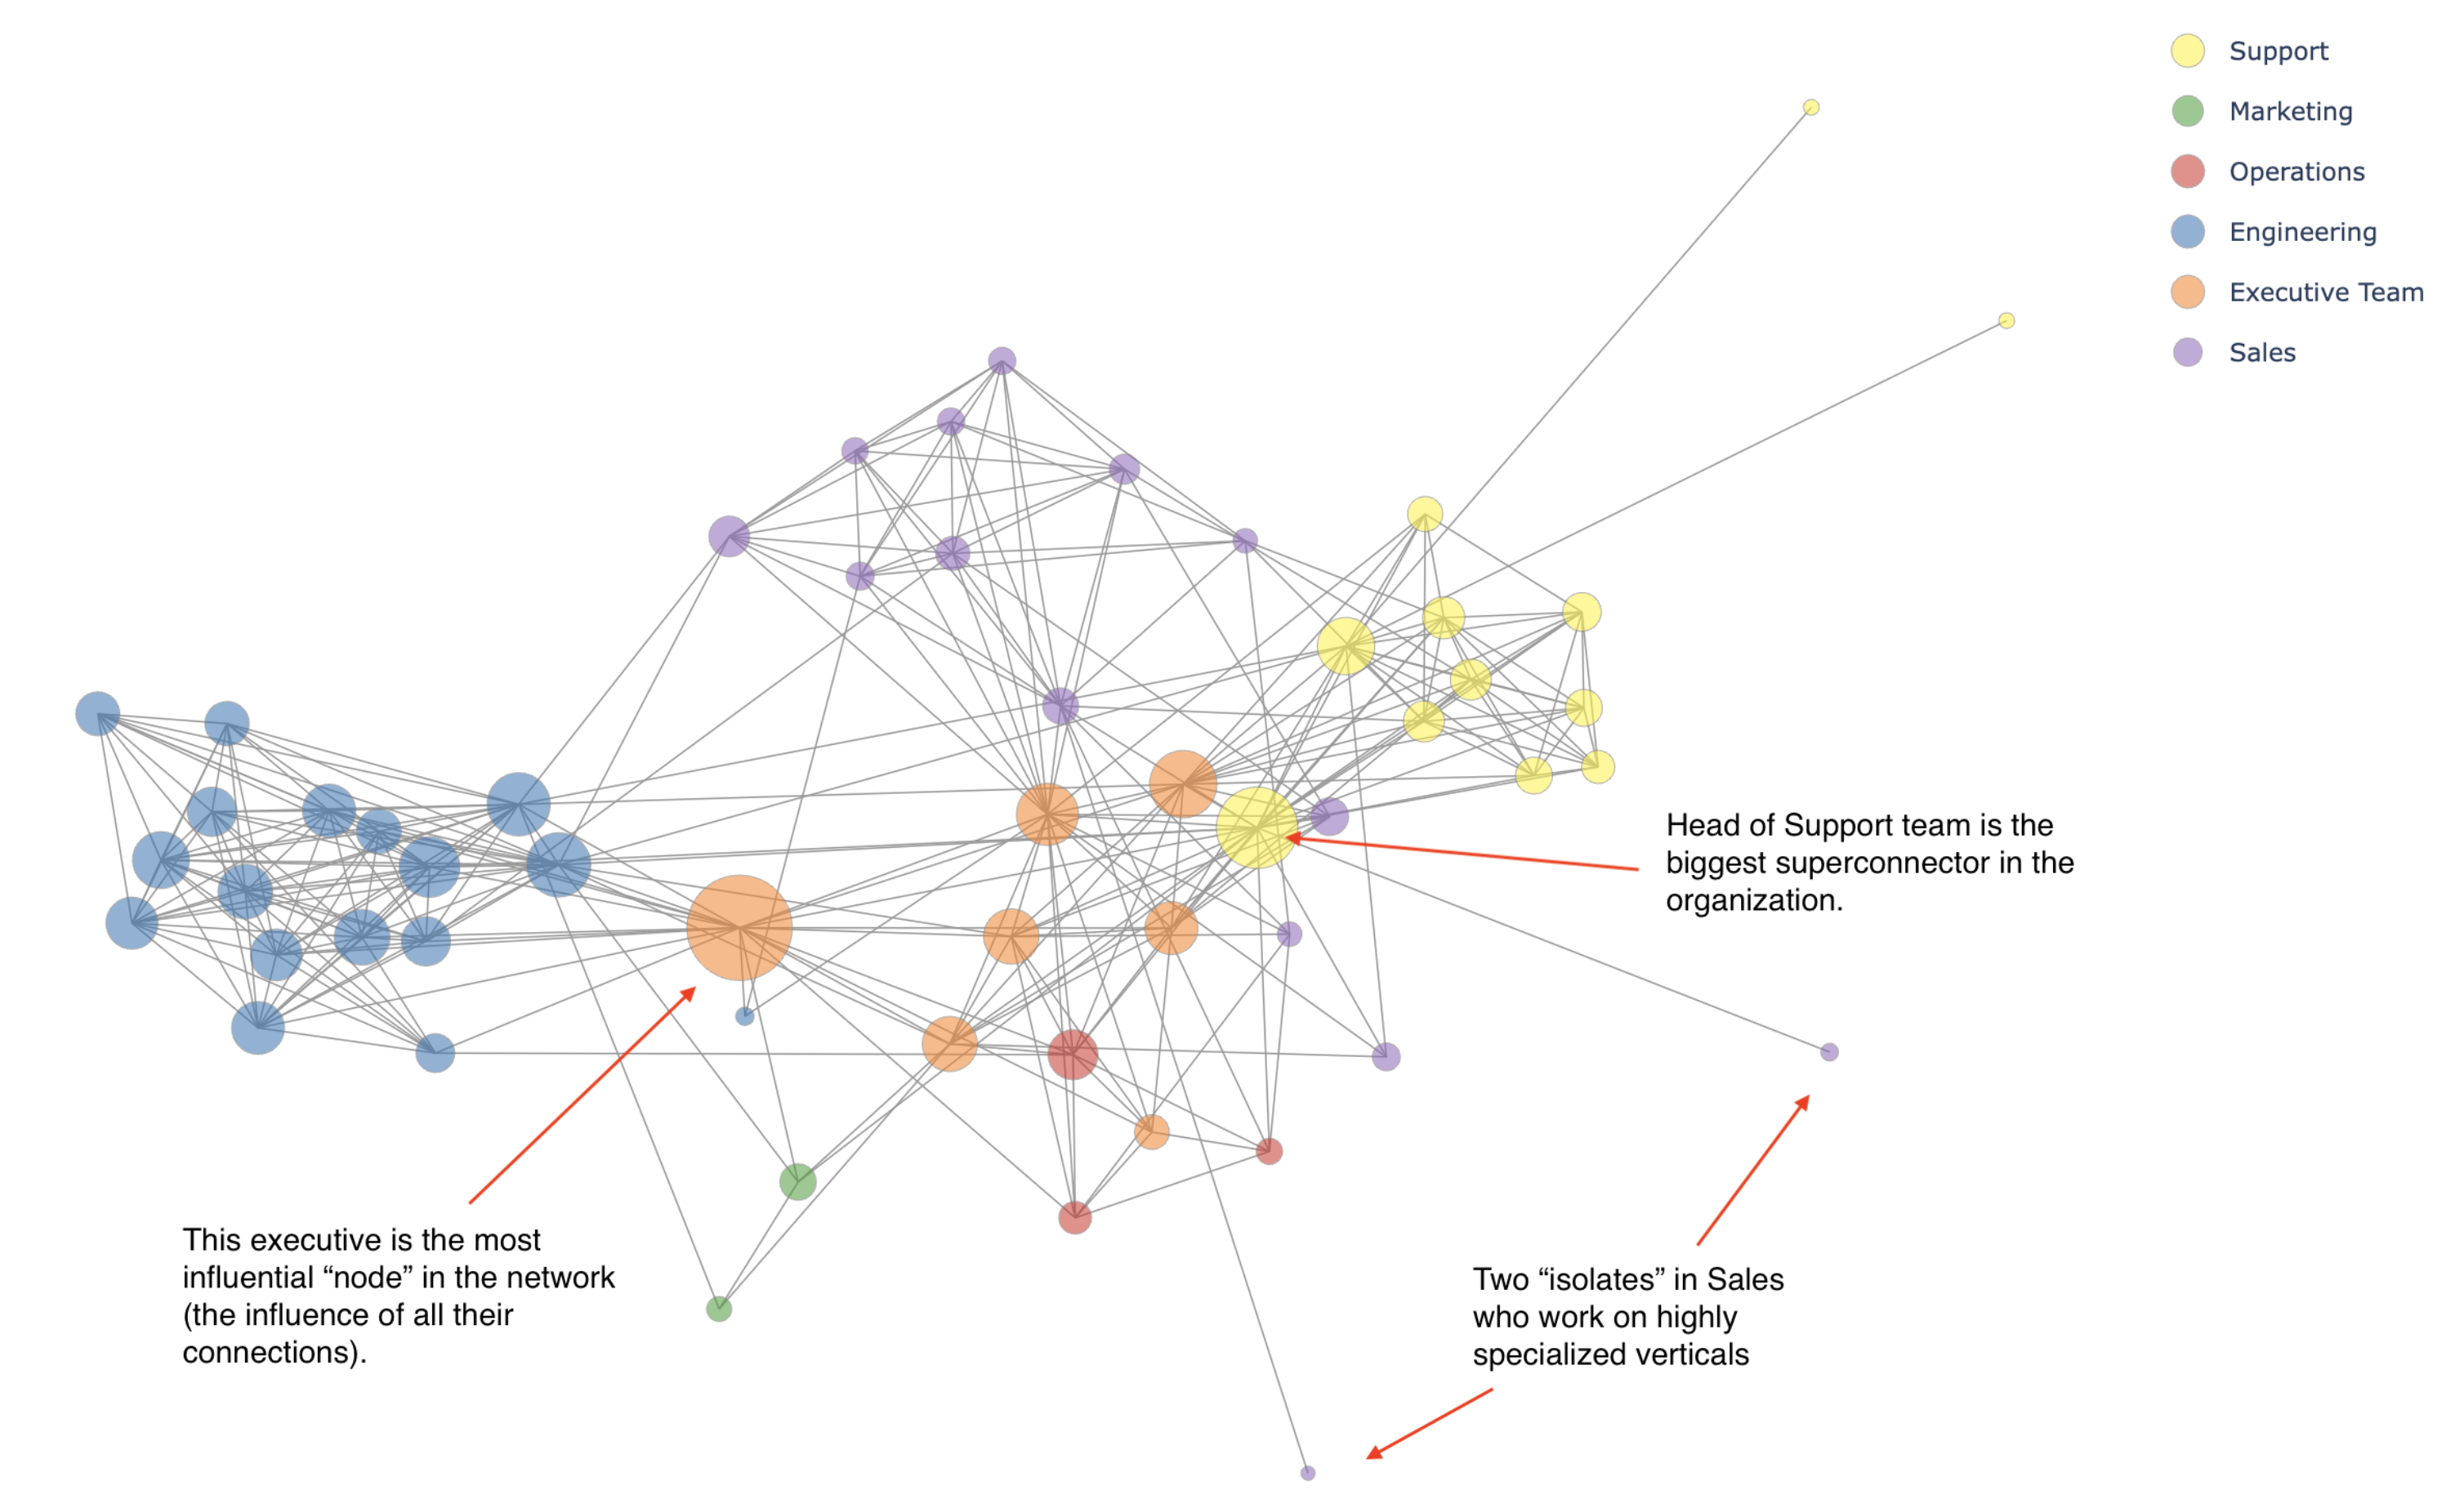
Super-Connectors and Isolates
As you map the real patterns of collaboration, you start to notice different roles people play in the flow of work.
Some individuals are super-connectors — they work across functions, pass context between teams, and are involved in many threads of communication. Others are isolates, not in a social sense, but in a functional one. They’re focused, often deep in individual work, with fewer but more specialized collaborations.

Neither is better or worse. Super-connectors help keep the org in sync. Isolates often drive deep, focused execution. But when you’re designing systems, launching initiatives, or responding to change, it’s essential to know where people sit in that spectrum — because the same change affects them in very different ways.
Understanding that distribution helps you support each kind of contributor — and avoid misfires in org design or communication.
Built on What People Already Do
Instead of asking employees to fill out surveys or nominate teammates, we tap into the digital breadcrumbs they already leave behind while working:
- Engineers reviewing each other’s code
- Designers collaborating in Figma
- PMs writing and commenting on docs
- Sales reps joining calls with support and success
- Teams messaging in Slack and meeting in Zoom
These interactions, taken together, form a living picture of collaboration — automatically and passively. No extra forms. No added friction. Just a clearer view of how work gets done.
Why It Matters
This real-time map powers smarter systems.
Take feedback. In most tools, you’re asked to pick who should review you. People usually choose their friends, not their collaborators.
We do it differently. Windmill suggests reviewers based on actual working relationships — including recent ones — so feedback is grounded in reality and easier to give. That keeps it lightweight, fair, and more relevant.
It also cuts down on the overhead. You’re not filling out spreadsheets or picking names. You’re just working — and the system makes sure feedback flows naturally from that.
The Hard Stuff: Not All Meetings Are Equal
Not every interaction is equal, and that’s where it gets tricky.
A 1:1 is easy to interpret. So is a company-wide all-hands (lots of people listening, not much back-and-forth). But what about a 6-person design review? Maybe two people are deep in discussion while others are just observing.
Distinguishing that nuance — who’s actively contributing vs. who’s just present — is a hard problem. But it’s the kind we like. And as more meetings get transcribed, more tools offer metadata, and more collaboration becomes digital-first, we’re getting better at it every day.
The Future: Design by Simulation
Here’s where this goes.
Imagine having a live network view of your organization — not just a static diagram, but one that evolves week to week. Then imagine being able to simulate changes:
- What happens if you reorganize these two teams?
- What if you move this person to a new project?
- Will communication improve? Will execution slow down?
That’s the future: organizational design with feedback loops. A system that helps you experiment, learn, and build a company that works better over time.
Because running a great company isn’t just about strategy. It’s about coordination. And coordination starts with knowing how your people really work together.
Stay in the loop
Get the latest updates, insights, and news from Windmill delivered to your inbox.